Blog / BIM & Construction Management
7 Remarkable Infrastructure Projects Powered by GIS
Categories
GIS, or Geographic Information Systems, is a system designed to capture, store, analyse, and manage spatial or geographic data.
In the world of civil engineering and infrastructure development, GIS plays a crucial role. It enables engineers and planners to make informed decisions about land use, transportation, and infrastructure projects through precise mapping, spatial analysis, and real-time data integration.
In this article, we explore seven remarkable projects that showcase how Geographic Information Systems (GIS) are driving innovation, sustainability, and progress in civil engineering. These examples will illuminate the boundless possibilities when we combine geospatial data and technology to shape a better future for our cities and communities.
1- London's Crossrail Project, UK
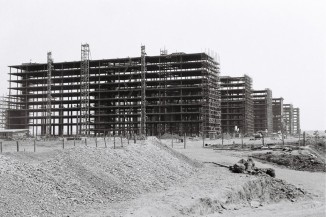
The London Crossrail Project, now known as the Elizabeth Line, is a monumental infrastructure initiative in the UK, that involved the construction of a new high-capacity rail line that traverses London from east to west. It connects key areas of the city, relieving congestion and improving transportation access for millions of commuters by using a combination of underground and surface rail networks.
The project used GIS at every stage, from initial planning and land acquisition to construction, operation, and ongoing maintenance.
- Route Planning and Optimization: GIS played a crucial role in determining the optimal route for the Crossrail project. By overlaying various spatial data sets, including existing infrastructure, land use, geological information, and demographic data, project planners could identify the most efficient path for the new rail line. This helped minimise environmental impact and construction costs.
- Land Acquisition and Property Management: GIS was used to manage the acquisition of land and properties along the Crossrail route. It allowed project managers to maintain detailed records of land ownership, legal boundaries, and property values, ensuring efficient negotiations and land procurement.
- Spatial Data Integration: The project integrated diverse spatial data sources, including topographic maps, satellite imagery, and geospatial databases. This integration enabled a comprehensive understanding of the physical and environmental context in which the rail infrastructure would be developed.
- Environmental Impact Assessment: Crossrail project planners used GIS for environmental impact assessments. By analysing environmental data, such as protected habitats, air quality, and noise pollution, they could develop strategies to mitigate the impact of construction and operation on the surrounding areas.
- 3D Modeling and Visualization: GIS technology was used to create 3D models of the underground rail system. This allowed for the visualisation of the entire project, helping stakeholders and the public understand the project's scope and its relationship with the city's existing infrastructure.
- Geospatial Asset Management: Once the rail line was operational, GIS continued to play a role in asset management. It facilitated the monitoring and maintenance of rail assets, including tracks, stations, and signalling systems, to ensure smooth operations.
- Real-time Data Integration: GIS technology also supported the integration of real-time data, enabling the tracking of train locations and passenger information. This enhanced the overall safety and efficiency of the rail system.
- Public Engagement: GIS was employed to create interactive maps and visualisations that were used for public engagement and communication. These tools allowed residents and stakeholders to better understand the project's impact and progress.
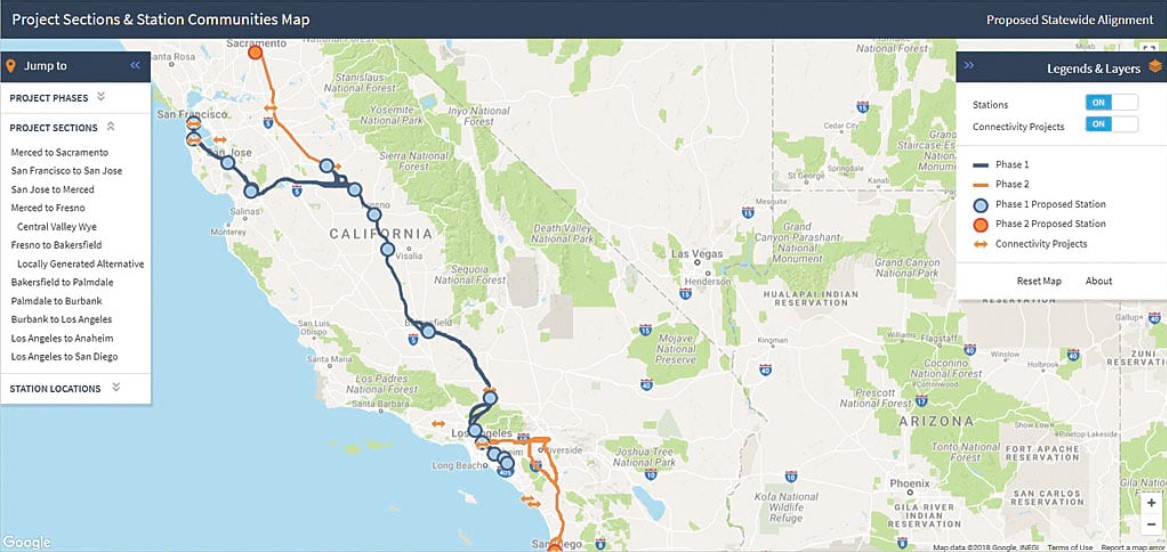
2- High-Speed Rail in California, USA
This major initiative focused on building a high-speed rail network connecting key cities in the state. It is designed to enhance transportation efficiency and reduce congestion by offering fast and sustainable rail travel options for residents and visitors in California.
The High-Speed Rail (HSR) is a testament to the crucial role GIS plays in planning, designing, and executing large-scale transportation infrastructure projects.
- Route Planning and Alignment Selection: GIS technology was instrumental in the initial phase of the project. Planners used GIS to analyse vast amounts of geographical data, including terrain features, land use, population density, and environmental factors. By overlaying these data layers, they identified the most suitable route alignments for the high-speed rail corridor. This data-driven approach helped minimise environmental impact and optimise the route for efficiency and accessibility.
- Environmental Impact Assessment: California's strict environmental regulations necessitated a comprehensive environmental impact assessment. GIS was employed to model and assess potential environmental impacts, such as effects on wildlife habitats, water bodies, and air quality. The system helped in the planning of mitigation measures to address these impacts, ensuring compliance with environmental regulations.
- Land Acquisition and Property Management: GIS was used to manage land acquisition and property rights along the rail corridor. It maintained detailed records of landowners, property boundaries, and land values, streamlining negotiations and facilitating the acquisition process.
- Utilities and Infrastructure Integration: GIS technology allowed for the integration of existing utilities and infrastructure data into the project planning. This ensured that the high-speed rail alignment would avoid clashes with existing infrastructure, such as roads, water lines, and electricity grids, and helped minimise costly relocations.
- Geospatial Surveying and Data Collection: High-precision surveying and data collection methods, such as LiDAR and photogrammetry, were integrated with GIS. This data provided highly accurate information about the terrain, existing structures, and vegetation, which was vital for detailed design and construction planning.
- Stakeholder Engagement and Public Communication: GIS was used to create interactive maps and visualisations for public engagement. These tools allowed project stakeholders and the public to understand the proposed rail alignment, station locations, and the project's impact on their communities.
- Construction and Asset Management: During construction, GIS supported project management by tracking the progress of construction activities and providing real-time information on the status of the rail project. After completion, GIS continued to be a valuable tool for asset management, aiding in the maintenance and operation of the high-speed rail infrastructure.
- Emergency Response and Safety: GIS was also used for emergency response and safety planning. It provided a platform for disaster preparedness and response by mapping critical infrastructure, evacuation routes, and vulnerable areas.
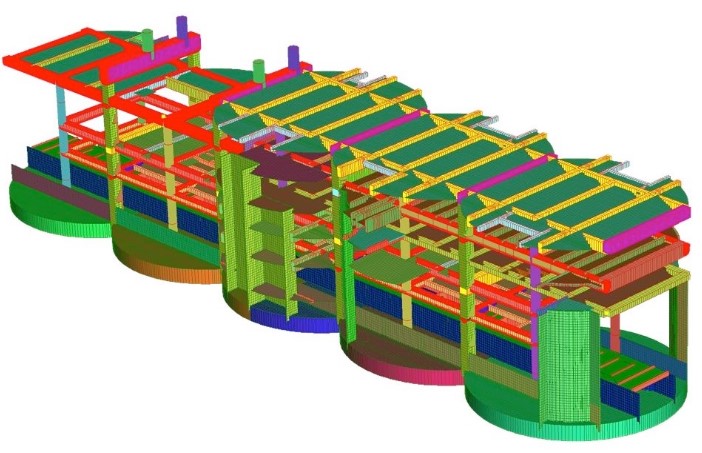
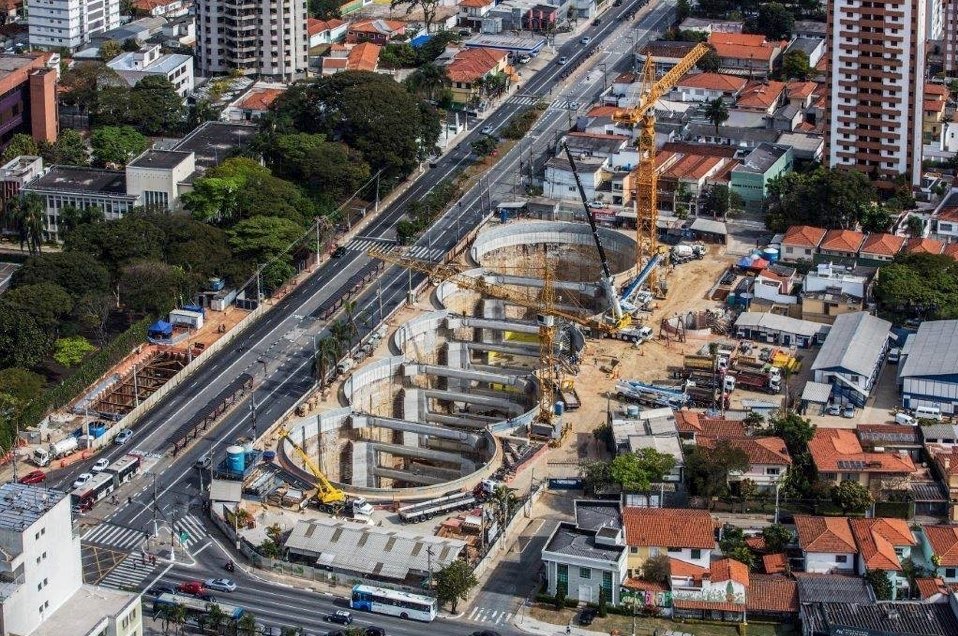
3- São Paulo Metro Expansion, Brazil
The São Paulo Metro Expansion involved the construction of new metro lines, stations, and associated infrastructure to improve mobility and reduce traffic congestion in one of Brazil's largest and most densely populated cities. The project leveraged GIS to plan and optimise new lines, stations, and transportation routes.
- Route Planning and Optimization: GIS played a vital role in selecting the optimal routes for new metro lines. By analysing spatial data, including population density, traffic patterns, and land use, planners could identify the most efficient corridors for expansion, reducing congestion and improving accessibility.
- Land Acquisition and Property Management: GIS was used to manage land acquisition and property information. It maintained records of land ownership, property boundaries, and values, streamlining negotiations and facilitating land procurement for the expansion.
- Environmental Impact Assessment: São Paulo Metro Expansion required rigorous environmental impact assessments. GIS helped model and assess potential environmental impacts, allowing planners to develop strategies for mitigating adverse effects on ecosystems, air quality, and noise pollution.
- 3D Visualisation: GIS technology created 3D models of the planned metro expansion. This visual representation helped stakeholders, including the public and decision-makers, understand the project's scale, alignment, and impact within the city's existing infrastructure.
- Utility Integration: GIS facilitated the integration of existing utility and infrastructure data into the project's planning phase. This ensured that the metro expansion would avoid conflicts with utilities such as water lines, electrical systems, and sewage, preventing costly relocations.
- Real-time Data and Passenger Information: After implementation, GIS continued to play a role in the operation of the expanded metro. It allowed for the tracking of train locations in real-time, passenger information, and service disruptions, enhancing the safety and efficiency of the transit system.
- Public Engagement: GIS was instrumental in creating interactive maps and visualisations for public engagement. These tools helped the public understand the project's details, route changes, and construction progress, fostering transparency and community involvement.
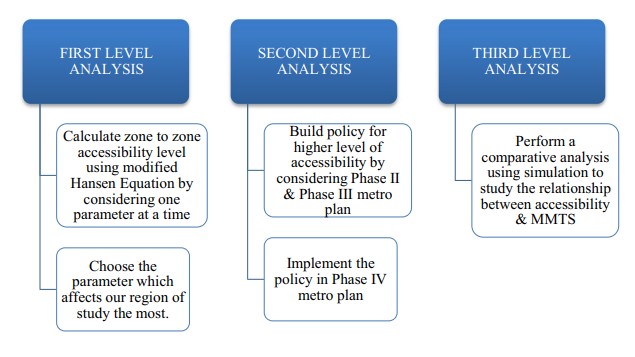
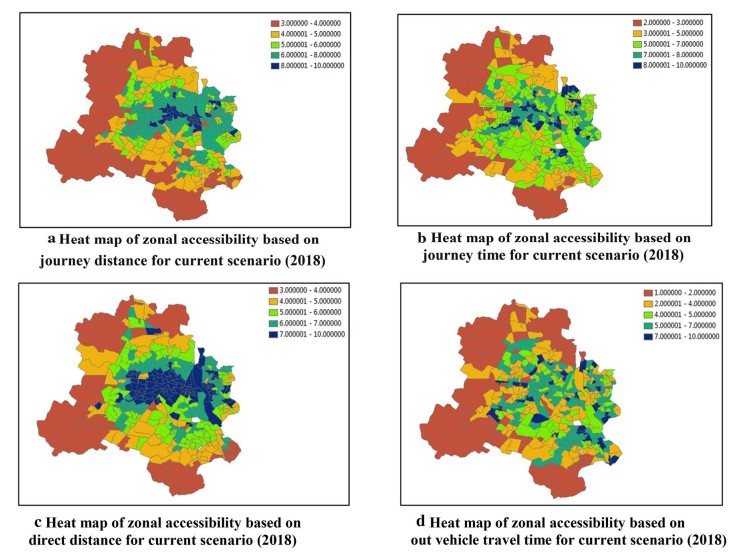
4- Delhi Metro, India
The Delhi Metro project encompasses multiple metro lines, stations, and associated infrastructure, providing a safe, efficient, and sustainable transit system for millions of residents and commuters in the National Capital Region (NCR). It is one of the largest metro networks in Asia.
It is a prime example of GIS application for urban transportation planning.
- Route Planning and Alignment Selection: GIS played a pivotal role in selecting the most efficient and cost-effective route alignments for the metro lines. By analysing various spatial data, including population density, land use, and existing infrastructure, planners could determine optimal routes, reducing environmental impact and construction costs.
- Environmental Impact Assessment: The Delhi Metro project required comprehensive environmental impact assessments, given the city's complex urban environment. GIS was used to model and assess potential environmental effects, enabling the development of strategies to mitigate the project's impact on sensitive areas, air quality, noise levels, and ecosystems.
- 3D Modeling and Visualization: GIS technology allowed the creation of detailed 3D models of the metro system. This facilitated the visualisation of the entire project, enabling stakeholders and the public to understand the scale, alignment, and integration of the metro network with the existing urban landscape.
- Land Acquisition and Property Management: GIS was instrumental in managing land acquisition for the metro project. It maintained accurate records of land ownership, legal boundaries, and property values, streamlining the negotiation and procurement processes.
- Utility Integration: Delhi Metro integrated GIS with existing utility and infrastructure data to ensure efficient project execution. This coordination minimised conflicts with other utilities, such as water lines, electricity grids, and telecommunications infrastructure, reducing the need for costly relocations.
- Real-time Operations and Passenger Information: After the metro's launch, GIS continued to be a critical component for the day-to-day operation of the system. It facilitated real-time tracking of train locations, passenger information, and service disruptions, ultimately improving safety and operational efficiency.
- Public Engagement and Communication: GIS technology was used to create interactive maps and visualisations to engage the public and communicate project updates. These tools allowed residents, businesses, and stakeholders to understand the project's details and its impact on their communities.
- Asset Management: The Delhi Metro relied on GIS for asset management, ensuring that the infrastructure was properly maintained. GIS maintained data on asset locations, conditions, and maintenance schedules, which is crucial for efficient operation and maintenance.
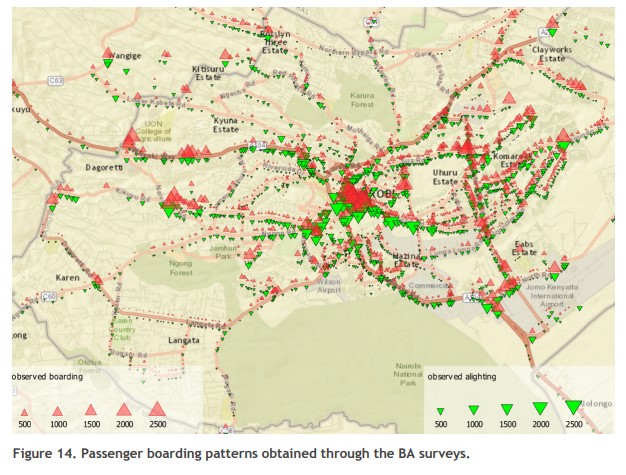
5- Nairobi's BRT System, Kenya
Nairobi's Bus Rapid Transit (BRT) system is a transformative public transportation infrastructure project featuring dedicated bus lanes, modern stations, elevated boarding platforms, high-capacity buses, and intelligent traffic management. It seamlessly integrates with other transportation modes, emphasises aesthetics and landscaping, and prioritises accessibility. The BRT system's design aims to enhance transportation efficiency, reduce congestion, and provide a sustainable, user-friendly, and inclusive public transit system for the city's residents.
Here are some key points regarding the use of GIS in Nairobi's BRT System:
- Spatial Data Analysis: GIS tools were used to analyse and visualise spatial data, helping planners understand the geographical context of the project, such as land use patterns, traffic flow, and population density.
- Route Planning: GIS played a crucial role in selecting the optimal BRT routes by considering factors like traffic congestion, existing road networks, and population distribution to maximise efficiency and accessibility.
- Land Use Planning: GIS allowed planners to assess how the BRT system would impact land use, facilitating informed decisions about station locations, urban development, and zoning regulations.
- Real-time Traffic Management: GIS technology enabled real-time traffic monitoring and management, helping authorities adjust routes and schedules to alleviate congestion and improve transportation efficiency.
- Environmental Impact Assessment: GIS was used to evaluate the environmental impact of the BRT system, including air quality, noise pollution, and carbon emissions, to make environmentally conscious design choices.
- Public Transport Accessibility: GIS analysis helped determine the accessibility of the BRT system for the public, ensuring that it would serve areas with the greatest demand and benefit local communities.
- Emergency Response Planning: GIS was utilised to create emergency response plans for the BRT system, ensuring that first responders could quickly access and navigate the network during incidents.
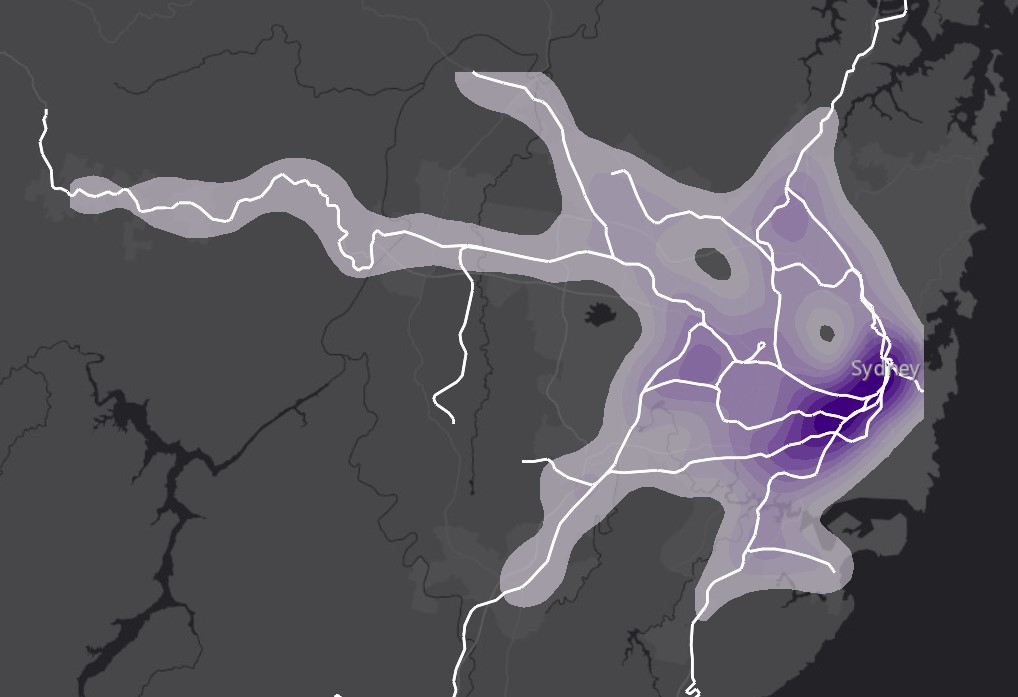
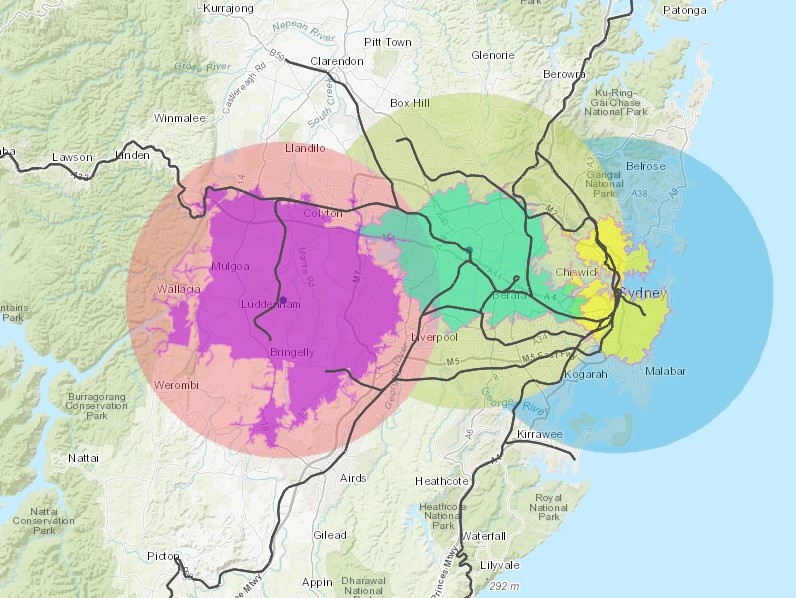
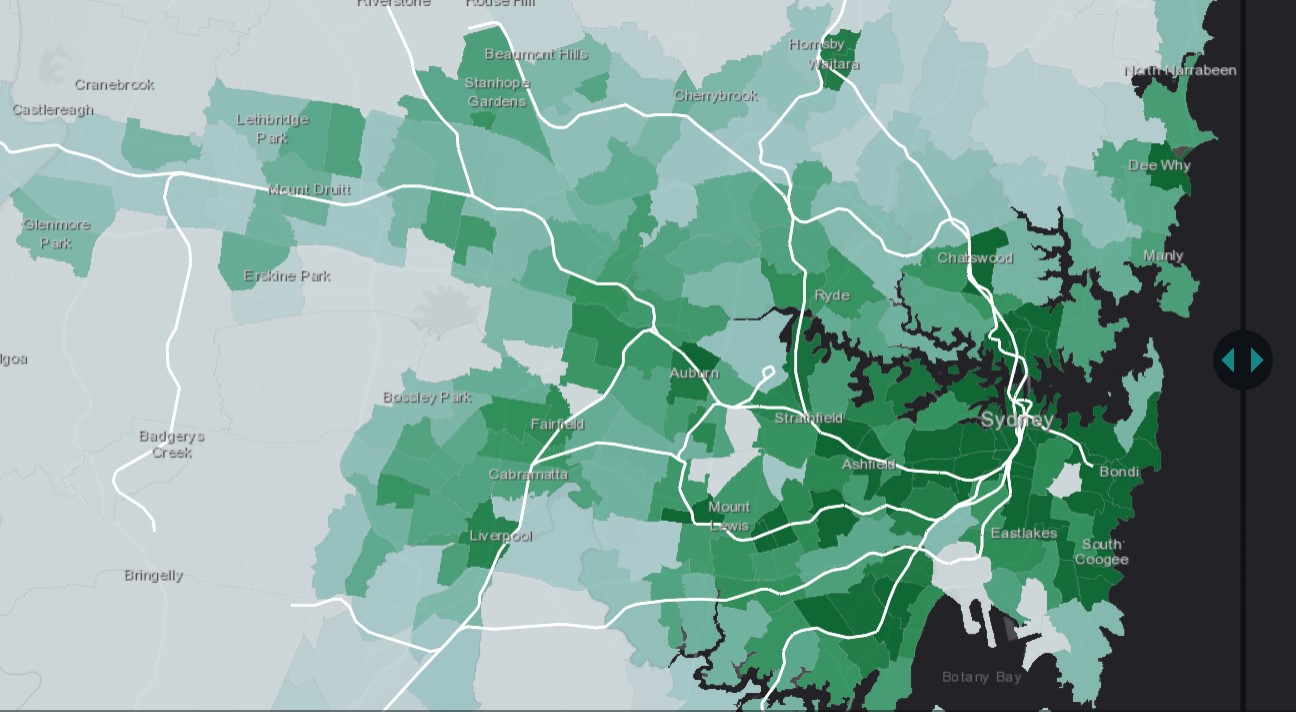
6- Sydney Light Rail, New South Wales
The Sydney Light Rail in New South Wales is a sustainable urban transportation project characterised by dedicated tracks, low-floor, high-capacity vehicles, and seamless integration with the city's infrastructure. Its advanced technology enhances operational efficiency and safety, while its electric-powered vehicles reduce emissions and contribute to a cleaner environment. The system prioritises passenger convenience and accessibility, serving as a vital component of the city's public transit network. With minimal traffic disruption, it exemplifies well-integrated and sustainable urban infrastructure in the field of civil engineering.
This project relies on GIS to plan, design, and manage the tram network connecting key areas of the city. It enhances transportation and urban development in the region.
- Geospatial Mapping: GIS is used to create accurate geospatial maps of the project area, detailing existing infrastructure, utilities, and land use patterns, providing a comprehensive understanding of the project's context.
- Route Planning: GIS tools assist in route planning by analysing topography, traffic patterns, and land use, allowing for informed decisions about the placement of light rail tracks, stations, and alignment.
- Spatial Analysis: GIS conducts spatial analysis to identify potential challenges and opportunities, such as environmental impact assessments, population density, and accessibility to ensure the project's viability.
- Utility Coordination: GIS facilitates utility coordination by mapping underground infrastructure, helping avoid conflicts and costly delays during construction.
- Asset Management: Throughout the project, GIS is employed for asset management, tracking the maintenance and operation of light rail infrastructure once it's in service.
- Risk Assessment: GIS aids in risk assessment by identifying areas prone to natural disasters, flooding, or other hazards, allowing for proactive mitigation measures.
- Environmental Impact Assessment: GIS plays a crucial role in assessing the environmental impact of the light rail, including noise pollution, air quality, and biodiversity, ensuring responsible and sustainable development.
- Public Engagement: Geospatial data visualisation helps engage the public by conveying project plans in an understandable manner, fostering transparency and collaboration.
- Real-time Monitoring: During construction, GIS is used for real-time monitoring of construction progress, enabling project managers to make informed decisions and maintain the project schedule.
- Traffic Management: GIS helps in managing traffic flow during construction, mitigating disruptions, and optimising detour routes to minimise inconvenience for the public.
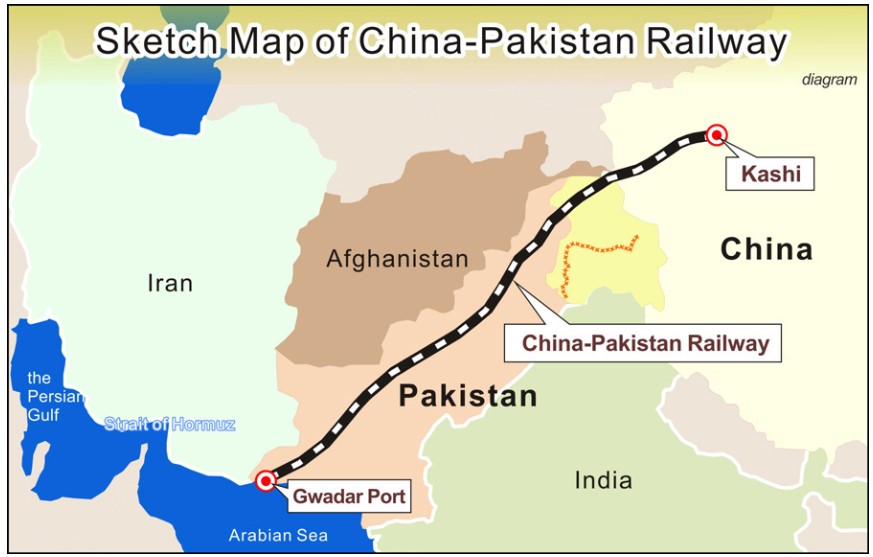
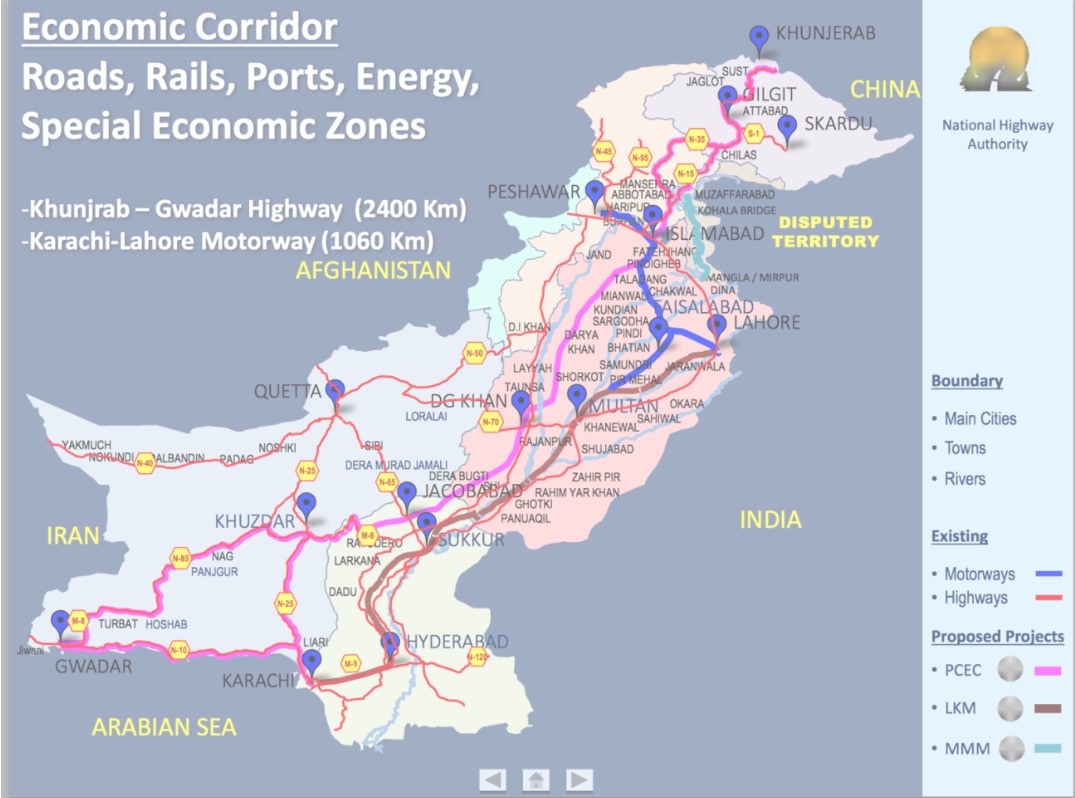
7- China-Pakistan Economic Corridor (CPEC), China/Pakistan
The China-Pakistan Economic Corridor (CPEC) is a massive infrastructure project that spans across China and Pakistan, and Geographic Information Systems (GIS) plays a crucial role in its planning, design, and execution:
- Geospatial Mapping: GIS technology is utilized to create detailed geospatial maps of the entire corridor, encompassing both countries, providing an accurate understanding of the project's geographical context.
- Route Selection: GIS tools aid in route selection by analyzing terrain, existing infrastructure, and population centers, enabling planners to identify the optimal path for highways, railways, and pipelines.
- Environmental Impact Assessment: GIS plays a key role in assessing the environmental impact of CPEC, including factors like air and water quality, land use changes, and potential habitats, ensuring responsible development.
- Resource Management: GIS is used for resource management, helping in the allocation and optimization of resources, including land, water, and energy, to support the project's needs.
- Infrastructure Coordination: GIS assists in coordinating the vast network of roads, railways, and pipelines, minimizing conflicts with existing infrastructure, utilities, and natural features.
- Security and Surveillance: GIS is integrated into security and surveillance systems, aiding in real-time monitoring and emergency response, ensuring the safety and security of the corridor.
- Public Engagement: Geospatial data visualization is employed for public engagement, allowing stakeholders and communities to visualize the project's scope and impact, fostering transparency and collaboration.
- Logistics and Supply Chain Management: GIS supports efficient logistics and supply chain management, optimizing the transportation of goods and resources along the corridor.
- Cross-Border Coordination: CPEC crosses international borders, and GIS is essential for seamless coordination between China and Pakistan, facilitating effective project management and border security.
In the ever-evolving landscape of civil engineering and infrastructure development, Geographic Information Systems (GIS) have emerged as indispensable tools.
The seven remarkable infrastructure projects we've explored in this article exemplify how GIS technology has revolutionised the way we plan, design, and build the world around us.
From Nairobi's BRT System to the Sydney Light Rail and the China-Pakistan Economic Corridor, GIS has provided valuable insights, precision, and sustainability in the face of urban challenges and global connectivity. These projects represent just a glimpse of the limitless possibilities offered by GIS, reminding us that the future of infrastructure is bright, informed, and sustainable, thanks to the power of geospatial data and technology.
Empower your infrastructures projects through BIM-GIS integration
If you are passionate about shaping the future of civil engineering and infrastructure projects, a Master's in Global BIM Management in Civil Engineering and GIS is the perfect avenue to delve deeper into the world of geospatial technology and its pivotal role in infrastructure development.
This programme offers the knowledge and skills necessary to master the applications of GIS and BIM, as showcased in the remarkable projects discussed in this article. By enrolling in this course, you can gain the expertise to drive innovative, sustainable, and transformative infrastructure projects worldwide.