Geographic information systems (GIS) for spatial analysis have several uses in different research fields such as medicine, social and environmental sciences, and engineering. Thanks to the currently existing tools, urban researchers can analyze a given issue within a specific area by considering its features: the transport means most used, the distribution of the population, the location of employment centers, or the location of the system of public facilities in a region.
In addition, the researcher can also make use of statistical analysis to detect trends and predict future behavior. This way, research becomes a powerful tool for decision-making that can significantly impact a given population group within a particular territory
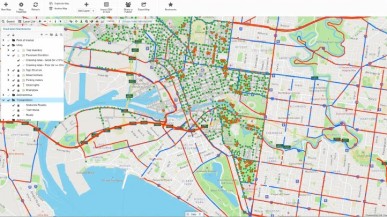
Displaying data related to positions on Earth’s surface
Victor Olaya, a member of the Open Source Geospatial Foundation (OSGeo), defines GIS as a system that combines information technologies, people, and geographic information. According to Olaya, the primary function of a GIS is to capture, analyze, store, edit and display georeferenced data, that is, data linked to a geographic position. The concept “system” itself entails that we are talking about an element that connects a set of components .

Source: arcweb.com
In other words, we can say that GIS consists of a set of specialized programs or softwares in virtue of which we can visualize databases related to positions on Earth’s surface by creating maps. Through these maps we can analyze and understand a given territory, which in turn allows us to make better decisions.
Uses of Geographic Information Systems (GIS)
At a practical level, a GIS enables the generation of cartographic material, the visualization and edition of geographic data, and the realization of spatial analysis through the development of operations based on georeferenced data. When it comes to visualization, geographic data layers, data tables, and vectors are required. The different data analysis tools of a GIS allow us to perform spatial queries, topological analysis, measure dimensions (areas, perimeters, length), as well as to create areas of influence, conduct surface analysis, and apply descriptive statistics such as mean or standard deviation. The overlap of geographic data layers through a GIS enables us to make more accurate decisions on a particular issue within a specific territory. This can be done by observing the spatial variable at a given time or a temporal variation of the same variable. That way, layered information allows us to develop solutions to typical questions raised by an urban researcher or manager, such as what is the most appropriate place to build a hospital or a garbage dump in a town or what is the best route for a new regional road.
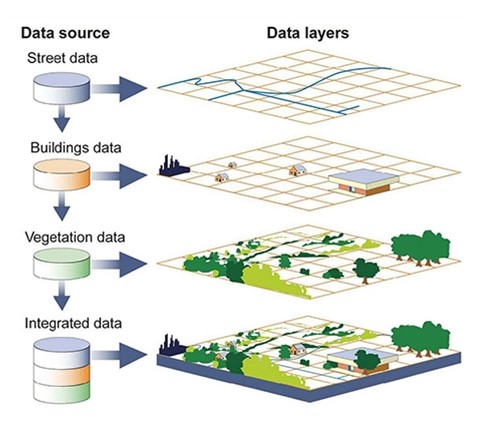
Source: nationalgeographic.org
Typology of GIS tools
Concerning the types of tools available on the GIS market for processing geographic data, there are, on the one hand, viewers and browsers, and on the other hand, complete desktop solutions. Among the viewers and browsers we can find, for instance, the Explorer for ArcGIS and ArcReader from the developer ESRI, Google Earth, and Google Maps. Among the most popular complete desktop solutions are the ArcGIS (the leading GIS software from developer ESRI), the GrassGis (which emerged in the mid-1980s as the first free and open GIS), the QGis (which is another free GIS code), the TransCAD (a well-known tool which has been designed to analyze and model transportation networks and systems worldwide), and the MapInfo Pro (a software developed for Windows with market analysis tools to improve strategic business decision-making).
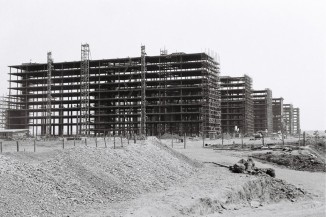
AMRUT: use of GIS in city planning in India
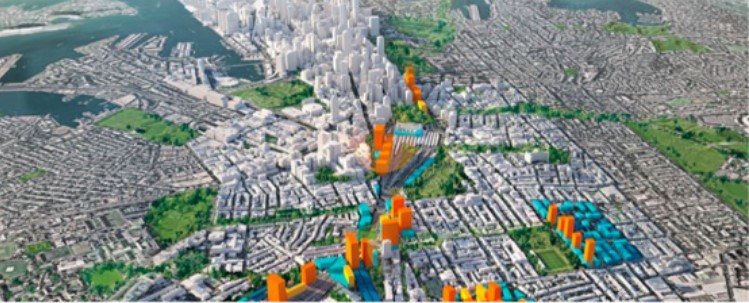
In 2015, the Indian Government launched the Atal Mission for Urban Rejuvenation and Transformation (AMURT) to ensure that 500 cities have universal water supply coverage, sewerage facilities, and adequate facilities for non-motorized transport. The AMURT, which uses Geographic Information Systems rather than conventional mapping as the primary tool for the Master Plans, is a symptom of the frenetic pace of urban growth in their cities. This is just an example of the many applications and benefits of GIS. By combining computer tools and geography in the current context of transformation and resilience to global and local challenges, GIS can help us study territories and manage
Smart Cities.
Source: india.smartcitiescouncil.com
1] --> V. Olaya. Introducción. ¿Qué es un SIG?”. Chapter 1. In V. Olaya. “Sistemas de Información Geográfica”. 2014. Fuente Imagen principal: GAO.
 |
Helena Ruiz Estupiñán, Econ. PhD in Gestión Urbana. Professor of the Zigurat's Máster Internacional Smart City Management.
|