Author
Zigurat Global Institute of Technology
Blog / BIM & Construction Management
Categories
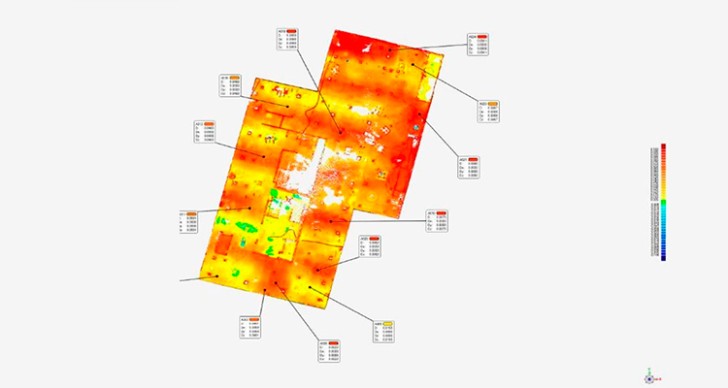
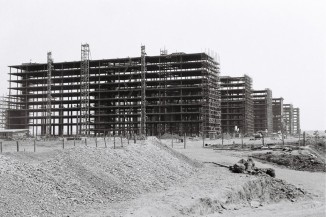
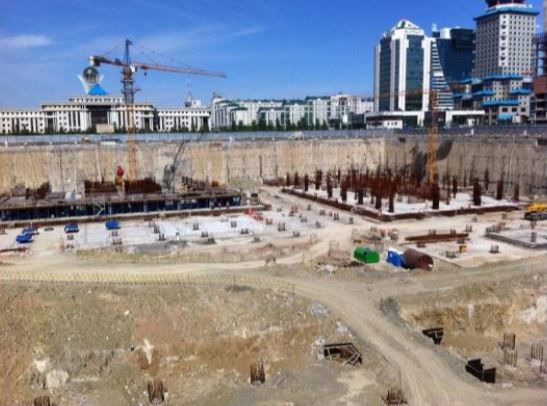 Figure 1a: Abu Dhabi Plaza
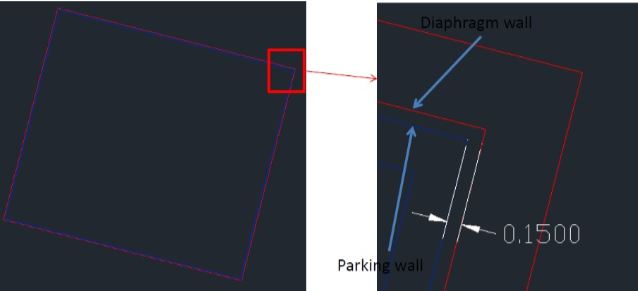
Figure 2: Diaphragm wall position in comparison with the inner wall
The high level of detail which is required cause the necessity to utilize a method which allows us to get the as-built situation as it is and to analyze into advanced CAD/BIM system.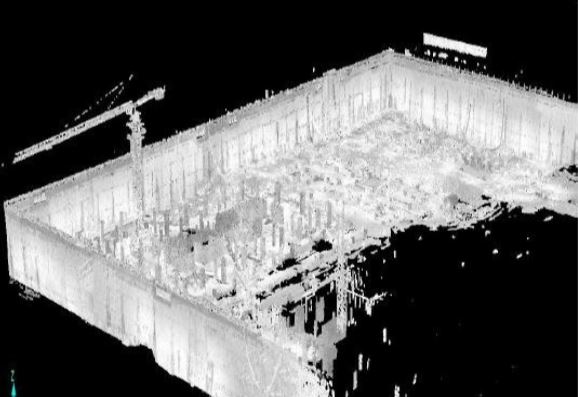
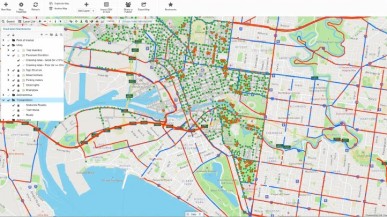
Figure 1b: Point clouds
Recent advances in generating 3D environments using laser scanning technologies, and acquiring quality information about built environments using embedded and other advanced sensors provide the capability to frequently gathering an integrated and accurate three-dimensional and material quality related as- built data. This information is combined with the design BIM model with an objective to create an integrated model which is dynamically updated during the construction period.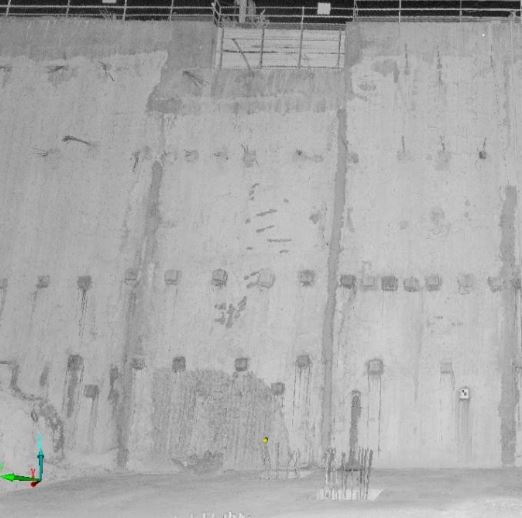 Figure 3: Image generated from the laser scanner illustrating the façade of the west section of the Dwall. Furthermore, the software allows us to generate horizontal cross section. The horizontal cross sections were generated in three elevation spots, one in the lower, one in the middle and one in the upper part of the wall. In total 150 vertical cross sections were generated and also 12 horizontal cross sections. In sectional view (figure 4) the slope of the wall and the verticality is highlighted as well as the direction of the deviation. Figure 4: Vertical cross section of the wall In the above figure, it can be seen, that the wall does not follow the verticality rules since there is a curve in the middle of the wall. In the right side of the figure 4, the as- built is represented superimposed by the design (red line), indicating the value and the direction of the deviation from the hypothetical wall position. In this example, the distance between the as-built Dwall position (white line) and the theoretical Dwall position (red line) is 25 cm, a value which violates the design specification. The figure below indicates a horizontal cross section. As it can be seen, the as-built Dwall position (white line) exceeds the theoretical position (red line) and penetrates into the boundary of parking wall (blue line).
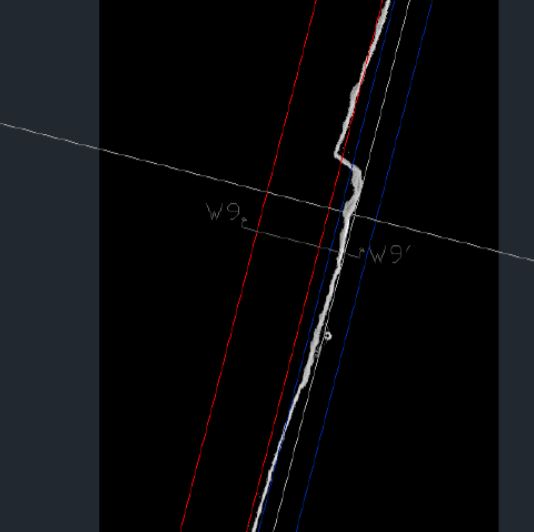
Figure 4: Horizontal cross section
The sectional analysis cannot cover the whole surface of the wall since the as-built conditions of the areas between the intervals are unidentified. Therefore, we need an integrated project model were the deviation is depicted in the whole surface of the wall providing the value and the pattern of the deviation in every spot. found, it can be evaluated according to construction specification to define if any detected deviation violate any specification and as a result constitute a defect. The resulted model constitutes a color based deviation model, as it is indicated in the figure 5. The color is assigned according to the value of the deviation between the as-built measured data and the design model. In figure 5, the areas which are red colorized represent the highest deviation with values which exceed 150mm. In contrast with the green colorized areas that present the lowest deviation with the values which are fluctuated between 0mm to 150mm. The positive pattern of deviation is illustrated with red shades while the negative deviation with blue shades. The red colorized areas (figure 5) indicate the areas where the wall penetrates into the parking wall and therefore must be trimmed. The green areas indicate the parts of the wall where the deviation is fluctuated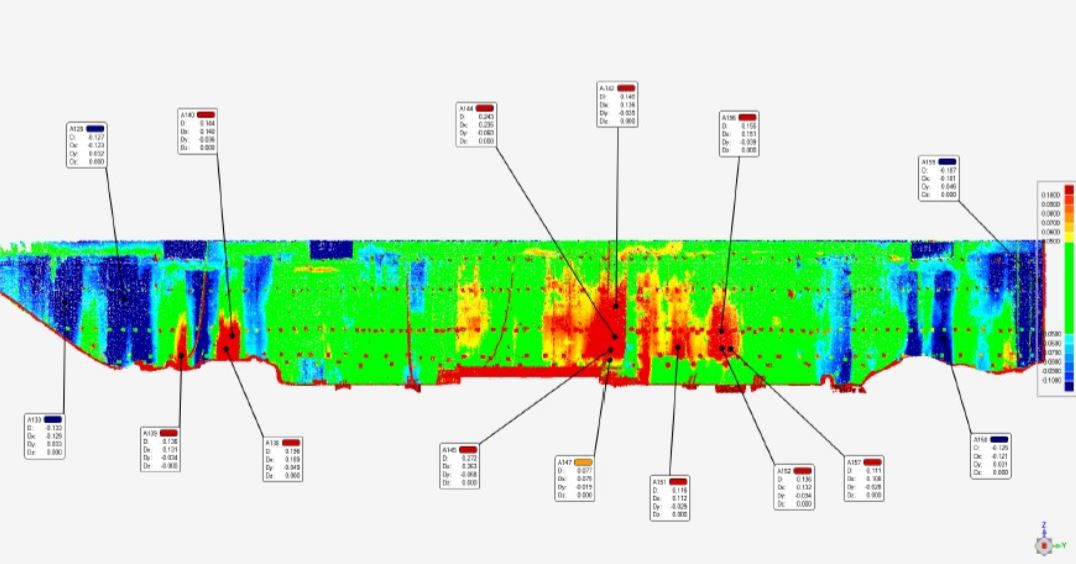
Figure 5: Color based deviation model of the West section of the wall
Identification of deviation can be completed by comparing the as built data, acquired by the laser scanner, to the given design model. Once the magnitude of deviation is within acceptable limits while the blue color indicates the areas where the wall is deviated with opposite direction. Foundation inspection The engineers also requested the inspection of the existing rafts (figure 6) which were constructed from the previous contractor. The rafts inspection involves the review of the slopes and comparison of the elevation with the design. The figure below indicates the fluctuation of the slopes of the foundation. The dark red shows the areas where the distance from the theoretical raft position exceed 10 cm while the green indicate the areas where the deviation is lower than 5mm. existing construction obey the design specification or violates them. The implementations of 3D technologies in combination with advanced software enable the engineers to locate the defects accurately and effectively. After the data acquisition stage, the as-built data are compared with the design with an objective to detect the deviations. In case, there are deviations which exceed the acceptable limits according to the specification then a further analysis is required. The quality control approaches.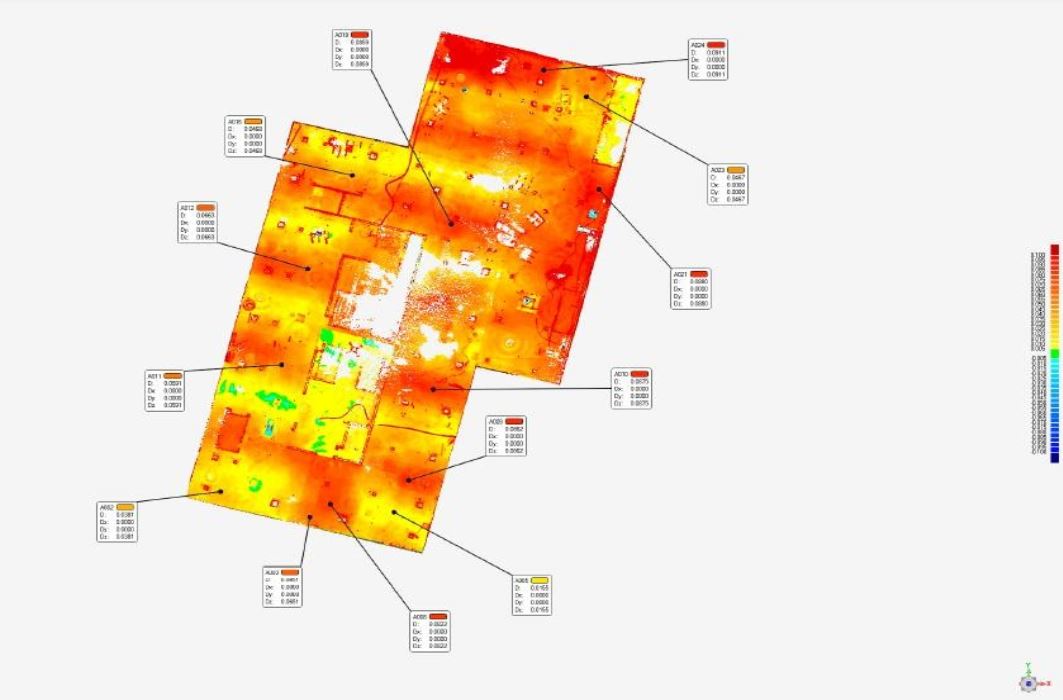
Figure 6: Raft inspection

Zigurat Global Institute of Technology